Author Archives: mstanton

Share: Politico Founder: ‘Journalists Are Killing Journalism’

Yet another Buzzfeed stunt highlights the economy of time among Gen Y influencers, and the potentially catastrophic fallout facing modern journalism as a result:

It was not so long ago — oh, say, five, maybe six years — that traditional news organizations like this one could laugh at BuzzFeed’s gag along with everyone else, smugly secure. An exploding watermelon was just an exploding watermelon. These days, however, news articles — be they about war, voting rights, the arts or immigration policy — increasingly inhabit social media feeds like the frighteningly dominant one that Facebook runs. They are competing for attention against zany kitchen experiments; your friend’s daughter’s bat mitzvah; and that wild video of a train whipping through a ridiculously narrow alleyway in India.

Full version: http://www.nytimes.com/2016/04/18/business/media/for-news-outlets-squeezed-from-the-middle-its-bend-or-bust.html

Share: Mobile Social Holds 85% Of Current Ad Dollar

The internet’s rapid removal of journalism content creators’ role as gatekeepers highlighted again here.

From the article: 

Online publishers have faced numerous financial challenges in recent years, including automated advertising and ad-blocking tools. But now, there is a realization that something more profound has happened: The transition from an Internet of websites to an Internet of mobile apps and social platforms, and Facebook in particular, is no longer coming — it is here.
It is a systemic change that is leaving many publishers unsure of how they will make money.
“With each turn of the screw, people began to realize, viscerally, that this is what it feels like to not be in control of your destiny,” said Scott Rosenberg, a co-founder of Salon who left the company in 2007.
Audiences drove the change, preferring to refresh their social feeds and apps instead of visiting website home pages. As social networks grew, visits to websites in some ways became unnecessary detours, leading to the weakened traffic numbers for news sites. Sales staffs at media companies struggled to explain to clients why they should buy ads for a fragmented audience rather than go to robust social networks instead.
Advertisers adjusted spending accordingly. In the first quarter of 2016, 85 cents of every new dollar spent in online advertising will go to Google or Facebook, said Brian Nowak, a Morgan Stanley analyst.

Share: Facebook AI Reading, Watching More Than Ever

More news on the artificial intelligence “AI backbone” helping engineers at Facebook. From the Tech Insider summary:

Filtering the News Feed: There are potentially thousands of stories that could be shown to you in the News Feed at a given moment, and the company uses AI to learn from what you like and show you stories that are more relevant to you.

Language translation: Facebook says that 50% of its users don’t speak English, and it’s using AI to translate text on a massive scale.

Photo search and tools for the visually impaired: Facebook says that AI is currently making the most progress in computer vision, which uses artificial intelligence learnings to analyze what’s in an image. The idea is that you could search for “snow” and see photos with snow in them. (Google Photos does this already very well). Facebook also uses AI to read aloud what’s in a photo for the visually impaired.

Analyzing what’s in videos on Facebook: Given how increasingly prevalent video is on Facebook, the social network is trying starting to analyze the contents of videos in real time and assign relevant content tags based on what’s in them.

Training its digital assistant, M: Facebook has been testing its own chat-based digital assistant called M inside the Messenger app. M uses a mix of AI and human trainers to help you do everything from buy movie tickets to research restaurants for dinner. M won’t be ready for prime time for awhile, unfortunately. Facebook is currently testing it with a few thousand beta users in California.

Full version: http://www.techinsider.io/facebook-has-ai-backbone-to-analyze-photos-videos-2016-4

Facebook blog update: https://code.facebook.com/posts/1072626246134461/introducing-fblearner-flow-facebook-s-ai-backbone/

Share: Advertisers Will Lose $7.2 Billion Globally To Bots In 2016

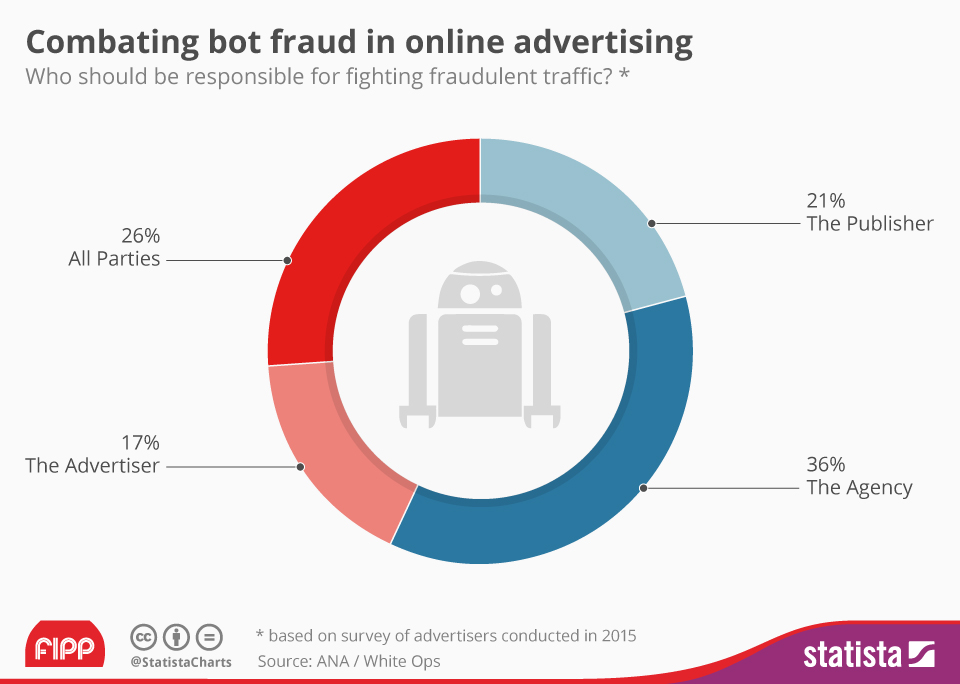
From a post by Statista’s Dyfed Loesche, this chart shows opinions on combating bot fraud in online advertising:

chartoftheday_4590_cambaing_ad_bots_n

Source: https://www.statista.com/chart/4590/cambaing-ad-bots/

Report from the Association of National Advertisers:

The Bot Baseline: Fraud in Digital Advertising

Advertisers will lose $7.2 billion globally to bots in 2016

Data was collected over 61 days from August 1 to September 30, 2015. All participants received proprietary information on their buys. The aggregate data is reported in the 2015 Bot Baseline study, and highlights are provided in the Key Findings Report and are below:

  • In 2015, advertisers had a range of bot percentages varying from 3 to 37 percent, compared to a 2 to 22 percent in 2014. But the overall rate of fraud was basically unchanged.
  • Media with higher CPMs (cost per thousand impressions) was more vulnerable to bots, as these segments provide a stronger economic incentive for botnet operators to commit fraud.
  • Sourcing traffic (any method by which publishers acquire more visitors through third parties) results in greater fraud. Sourced traffic had more than three times the bot percentage than the study average.
  • Fraud varies by buy type. Direct buys had lower fraud. Programmatic buys had greater fraud. Programmatic video ads had 73 percent more bots than the study average.
  • The annual financial impact of bot fraud ranged between $250,000 and $42 million for the 49 participating advertisers and averaged about $10 million per participant. The advertising industry overall could lose approximately $7.2 billion globally to bots in 2016.

Full version: http://www.ana.net/content/show/id/botfraud-2016

Download PDF report summary: http://www.ana.net/getfile/23470

What Are Typical Ad Rates?

Short answer: $1.80 per 1,000 views if you don’t care who will be seeing the ad.

Better answer: There are several ways any online channel or service can make revenue, but advertising – placing client messaging in and around site content – is pretty standard. There are many flavors of such ads, ranging from obvious display units (most commonly unseen due to adblockers), to advertorial and native advertising (brand-targeted paid messages mixed into site content); contextual links and “elsewhere on the web” recommandations (more ads posing as site content); and so forth and so on.

Ads may be sold directly by an online publisher (either as specific targeted placements, section sponsorships or custom solutions), but most ads come through ad networks that bid on publishers’ open inventory (unsold ad space) and essentially resell those ad positions to businesses and agencies. The network offering the highest bid to the publisher gets the space for certain hours of the day, or to users in specific geographical locations, or users matching some other sort of traceable criteria (ages, gender, past browsing habits all held in tracking cookies).

Doubleclick, Ad Exchange, Tribal Fusion, OpenX, Sharethrough, Komoona and Google AdSense are among the better known ad networks around these days.

More info:
https://en.wikipedia.org/wiki/Advertising_network#Types_of_ad_networks
https://en.wikipedia.org/wiki/List_of_advertising_networks

OK, so… What kind of money are we talking about here? Rates are measured by CPM, which stands for “cost per impression” — how much an advertiser is charged each time a specific ad message appears to a user, or put more mathematically, cost per 1,000 users. (The “M” in “CPM” is the Roman numeral for 1,000.)

Click to watch a video that has a 15-second commercial run before the clip plays? That’s one impression.

Visit a webpage has three display ads show off to the side of the content text and photos? That’s three impressions.

AllBusiness.com has a nice summary at https://www.allbusiness.com/web-advertising-and-cpm-a-quick-guide-for-small-businesses-2646-1.html regarding CPC versus CPA versus CPM…

CPC refers to “cost per click” and means you pay for each click your ad receives. If you are spending $1 for each click, then 10 clicks will cost you $10.

CPA refers to “cost per acquisition” and means you pay only when the click actually turns into a sale. This form of measurement is most commonly used in affiliate marketing.

CPM refers to “cost per thousand impressions.” An impression is a single instance of an ad appearing on a website.

You can calculate CPC fairly easily: If you spend $1 to get 1,000 impressions ($1 CPM) and you get 10 clicks (effective 1 percent CTR), then you paid $1 CPM and received a $0.10 CPC.

According to http://monetizepros.com/display-advertising/average-cpm-rates/ and other sites, estimates on the average CPM in 2015 for U.S.-based online properties look like this:

  • Site Display Ads (300×250) … $2.80
  • Site Banner Ads … $0.30
  • Facebook Banners … $2.00
  • Site Video Ads … $3.00 to $24.60 (depending on target)
  • Site Interstitial Ads … $1.80
  • Mobile Video Ads … $6.30
  • Mobile Interstitials … $5.00
  • Mobile Banners … $1.00
  • Email Ads … $5.00
  • Search Engine keyword text ads … $4.00 to $20.00

In comparison to traditional broadcast property ad commercial rates (varies by size of market, reach and ratings of station)…

  • Local radio spot (targeting adult age 25-54) … $50.00 to $100.00
  • Local TV station spot (outside primetime) … $10.00 to $30.00
  • Local TV station spot (popular primetime) … $35.00 to $50.00
  • National network TV 30-second spot … $2.6 million
  • National TV 30-second spot during CBS broadcast of Super Bowl 50 … $5 million

Other media (varies A LOT by brand and target)…

  • Direct mail … $26.50
  • Print magazine … $8.00 to $20.00
  • Billboards … $4.00 to $20.00

Newspapers vary by several factors (size and shape of ad, zone of distribution, color versus no color, weekday versus Sunday/holiday). Here’s a copy of the rate card used by the Minneapolis Star Tribune for basic retail rates:

StarTribuneRetail.pdf (March 2016)

Comparing CPMs between online buys, broadcast and print is a bit murky, but this Demand Media piece (via Houston Chronicle website at http://smallbusiness.chron.com/calculate-cpm-television-63243.html) is a good summary:

Ratings Are Everything

The best way to get an accurate CPM for a television advertisement is to know how good the ratings are of the television show with which your ad plays. Nielsen ratings are the golden standard for estimating the popularity of a television show. The average for a network series is 11 percent of the television-owning American population, which is estimated to be 94 million households, according to the Museum of Broadcast Communications. That means a show with ratings of 11 percent reaches 10.3 million people. The more popular a show is, the more expensive advertising around it will be. A less-expensive example would be a show that is seen by 5 million people.

The Equation

If your ad is featured next to an average television show that garners 5 million viewers, then you can use that figure to determine your CPM when you compare it to the price of advertising. First, divide the viewer number by 1,000, since you are calculating the cost of one thousand viewers. The amount you are working with now is 5,000. If you buy a single thirty-second advertising slot for $10,000, then divide that price by 5,000 for a CPM of $2. This is the cost per 1,000 people if you buy $10,000 of ad time during a show that gets 5 million viewers.

Sources:
http://monetizepros.com/display-advertising/average-cpm-rates/
http://smallbusiness.chron.com/calculate-cpm-television-63243.html
http://smallbusiness.chron.com/typical-cpm-74763.html

Share: ‘Citizen Journalism’ Craze Is Back

App works as an “Uber-ization” tool to turn everyone into paid journalists, much as Uber turned many into taxi drivers.

User-generated content has been slowly creeping into newscasts for years, but now Fox Television Stations is aiming to accelerate the practice with an app that lets the station group assign citizen journalists to happenings about town and then pay them for pictures and/or video from the scene.

[Fresco founder-CEO John Meyer] said that WTXF has made 150 assignments so far, but neither he nor Driscoll would say how many people have downloaded the app or been paid for content.

Fresco is more than an app. It operates a 24/7 newsroom in New York that checks assignments before they go out for accuracy and safety and then verifies the incoming content before making it accessible to the client, Meyer said.

The process is simple, he said. The producer at the station puts out a call for coverage — the assignment — using the Fresco website. That involves “dropping a pin on a map” and supplying a few details about what’s going on — be it a fire, accident or county fair.

“Once that assignment is posted, our newsroom will approve it within a minute or two and then, boom, our users with smartphones nearby are instantly notified,” Meyer said. “They travel to the scene and get the station on-demand video and photos in the matter of minutes.”

Stations actually pay $75 per video and $30 per still, but Fresco rakes off a third from each for its troubles. Users input a bank account number in the app, and payments are made directly to the account.

Full version: http://www.tvnewscheck.com/article/92960/fox-turns-viewers-into-stringers-with-app

App website: https://www.fresconews.com/

Share: Flash Is Dead (Yeah, I Know Already)

(Editor’s Note: A thousand years ago, I was a Flash developer. I have hundreds of .fla project files languishing in hard drives at home. You young kids take your AJAX and Responsive Design and iOS SDK and GET OFF MY DAMN LAWN. – Stanton)

From a post by Statista’s Felix Richter:

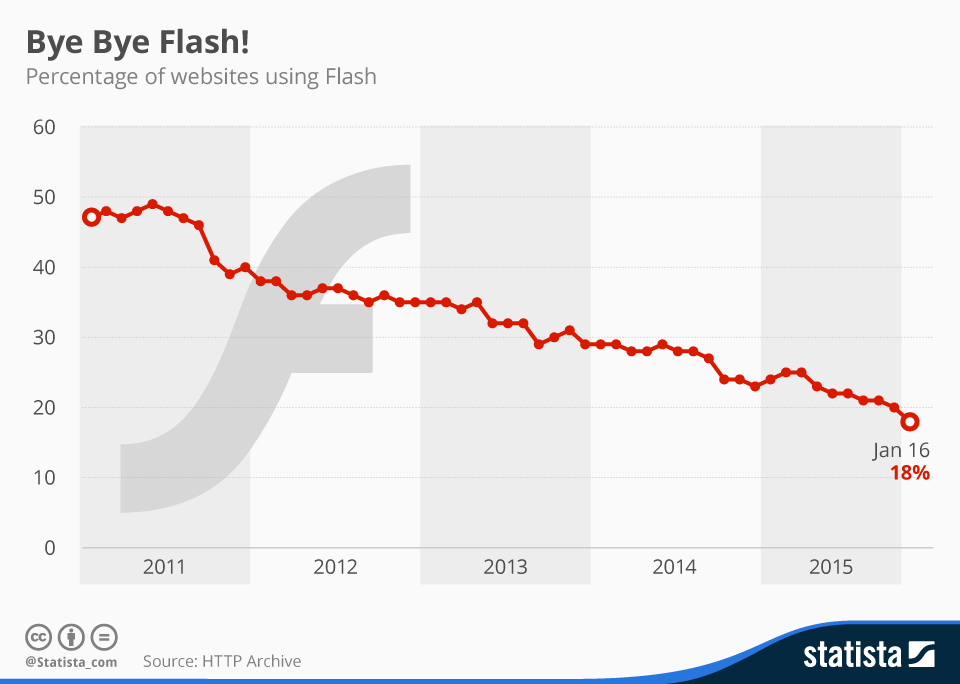
Google has announced yesterday that it won’t be accepting flash-based ads after the end of June 2016. From 2017 onwards all ads will have to be coded in HTML5. Flash is now widely regarded as a performance-hampering safety hazard and more and more companies are turning their back on what was once the industry standard. Citing security concerns, Mozilla recently disabled the Flash plugin in its Firefox browser by default; Amazon has banned it from its advertising network and other companies are following suite. In January 2016, just 18 percent of websites in the Alexa Top 10,000 used Flash, down from almost 50 percent four years earlier.

chartoftheday_3796_websites_using_flash_n

Source: https://www.statista.com/chart/3796/websites-using-flash/

Share: Most Spam Messages Originate in the U.S.

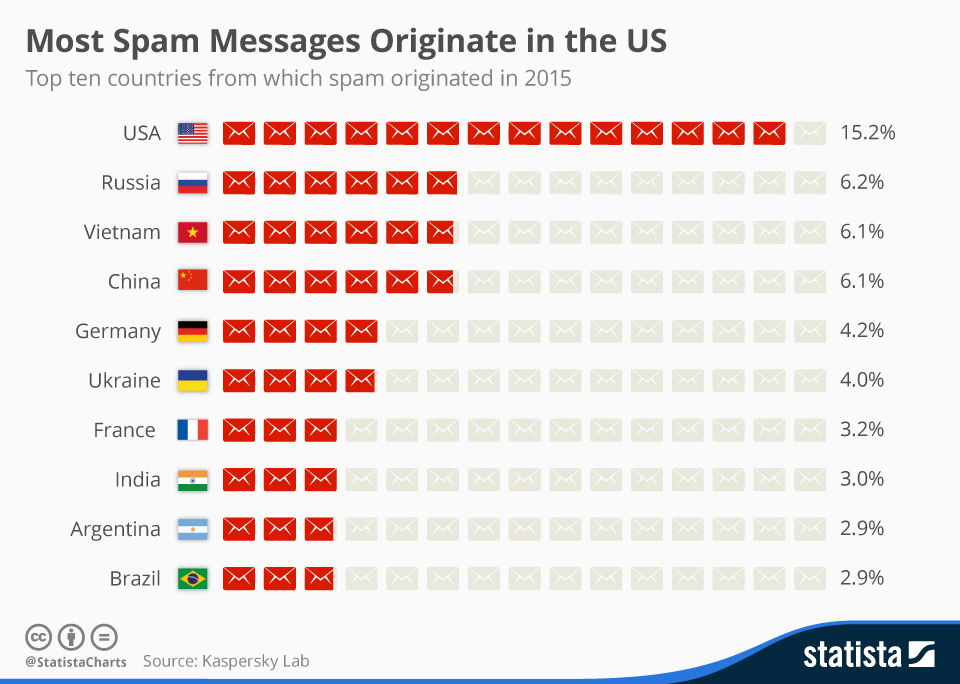
About 55 percent of all e-mails sent worldwide are unwanted ad or spam mails, according to security software business Kaspersky. The United States are the biggest source of spam, accounting for 15.2 percent of global spam traffic. Russia was in second place (6.2 percent) with Vietnam and China sharing third place (6.1 percent). The positive outlook being that the proportion of spam in e-mail flows was 55.28%, which was 11.48 percentage points lower than in 2014.

From a post by Statista’s Dyfed Loesche, this chart shows the top 10 countries from which spam originated in 2015.

chartoftheday_4338_most_spam_messages_originate_in_the_us_n

Source: https://www.statista.com/chart/4338/most-spam-messages-originate-in-the-us/